Tailored ensemble anomaly detection for Internet disruptions
Research paper on detecting Internet disruptions with tailored ensembles of anomaly detectors, published at ANT 2026.

Published at the 17th International Conference on Ambient Systems, Networks and Technologies (ANT 2026), Istanbul, Türkiye, and in Procedia Computer Science 280, pages 277-285.
Authors: Mike Vandersanden, Jelle Beerts, Hanna Kreitem, Amreesh Phokeer, Wim Lamotte and Peter Quax.
 Paper (Elsevier)
The work was done during my 2024 Internet Society Pulse Research Fellowship, as part of Digital Vigilance.
Summary
This paper proposes and evaluates an ensemble approach to detecting Internet disruptions, with one tailored detector per data source.
How it works
Internet disruptions show up differently in different measurements. The approach gives every data source its own simple, unsupervised detector, picked to fit that source, and lets the detectors vote. Because the votes stay visible, the prediction explains itself: you can see which sources triggered it.
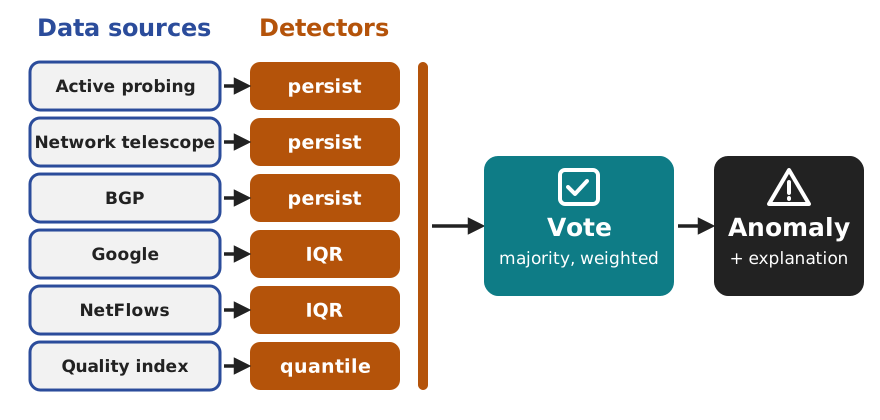
| Strategy | How it decides |
|---|---|
| Majority | More than half of the detectors must agree (weak majority: at least half) |
| Unanimous | All detectors must agree |
| Time window | Detectors may agree within a window, as sources feel a disruption at different times |
| Weighted | Sources that are known to be clear count for more |
It was tested on four cases (Iraq, Syria, Algeria and Jordan) with data from IODA and Cloudflare Radar.
- No detector fits everything, but sources with similar characteristics suit the same detector, so picking one per source works.
- Competitive without tuning. The tailored ensemble holds up against multivariate methods such as Isolation Forest and Elliptic Envelope, which need no tuning either. Weighted voting is the most consistent strategy, as majority voting with equal weights can fail when too few detectors fire.
- Explainable. The detectors that fired explain a prediction, without a slow post-hoc step like SHAP.
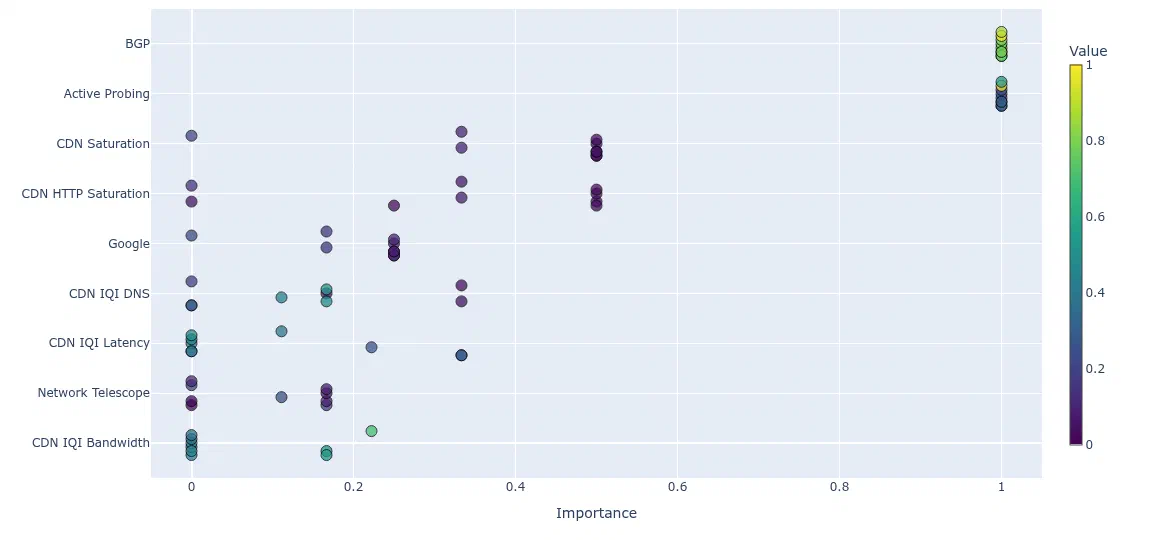
Which data sources drove each anomaly, for the Iraq case in the work: the further right, the larger the contribution. The color of the marks signal the measured relative value.
Cite
@article{vandersanden2026tailored,
  author    = {Vandersanden, Mike and Beerts, Jelle and Kreitem, Hanna and Phokeer, Amreesh and Lamotte, Wim and Quax, Peter},
  title     = {Tailored Ensemble Anomaly Detection for Internet Disruptions},
  journal   = {Procedia Computer Science},
  volume    = {280},
  pages     = {277--285},
  year      = {2026},
  publisher = {Elsevier},
  doi       = {10.1016/j.procs.2026.04.037},
}
 BibTeX
 Tags
Tags
 ANT 2026
 Research